This short tutorial shows how to export XPS data in the VAMAS format, which readily contains all information for CasaXPS software; sample image; and data labeling in CasaXPS.
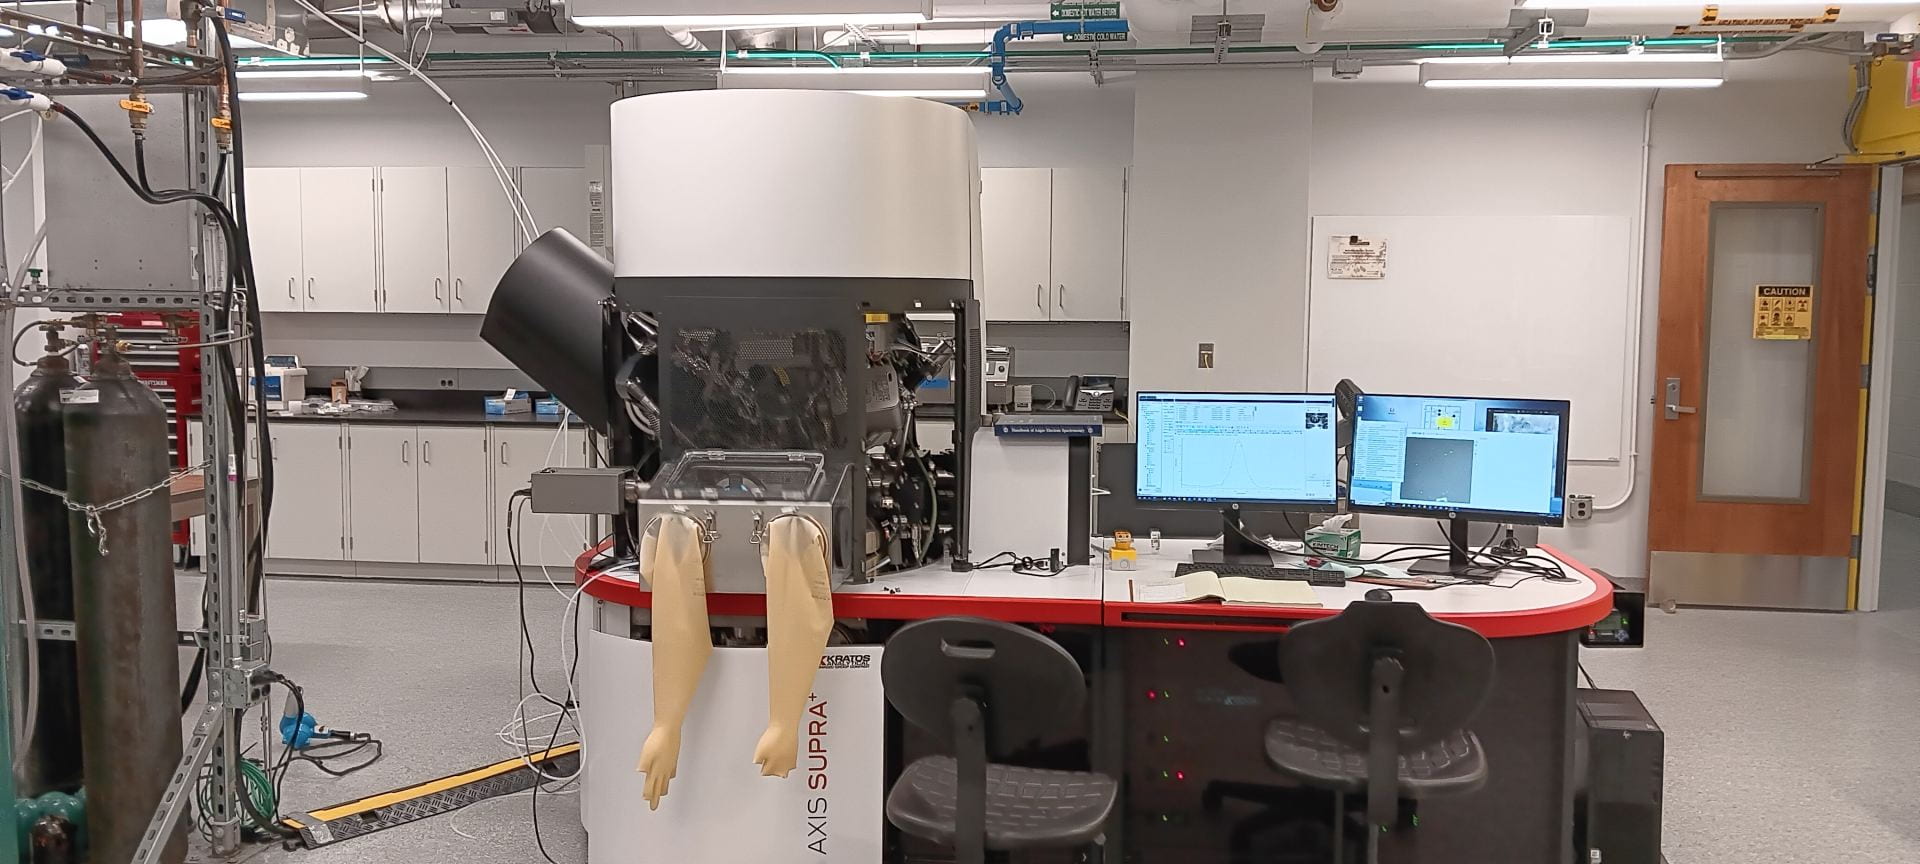
XPS data of Al2O3 is used as an example.
XPS Data Export:
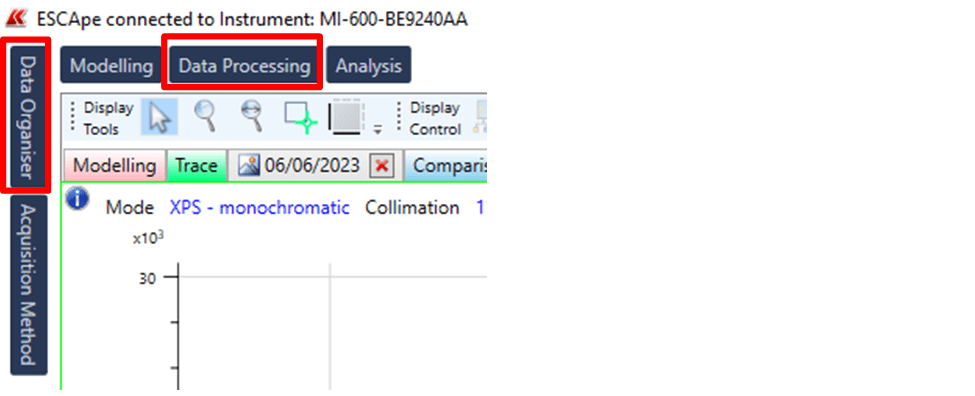
Go to “The Data Organizer” and “Data Processing” windows.
These two windows might already be open.
If not, the tabs can be found on the top left corner of the ESCApe software. Click on tabs to open the windows.
Note:
The ESCApe software sometimes doesn’t show all opened windows.
If the Data Processing/ Data Organizer windows don’t show up after clicking the tabs or if you can’t find the Data Processing/ Data Organizer tabs at all, it means these windows are already open, but are overshadowed by other windows.
Click the “Auto hide” button on unwanted windows to minimize them.

Once you minimize other windows, you should be able to see the Data Processing & Data Organizer.
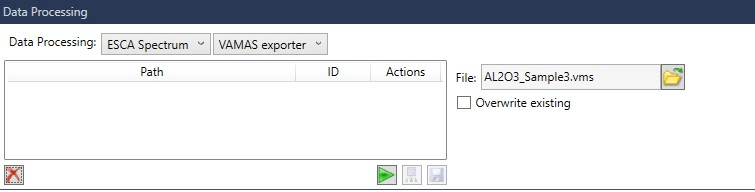
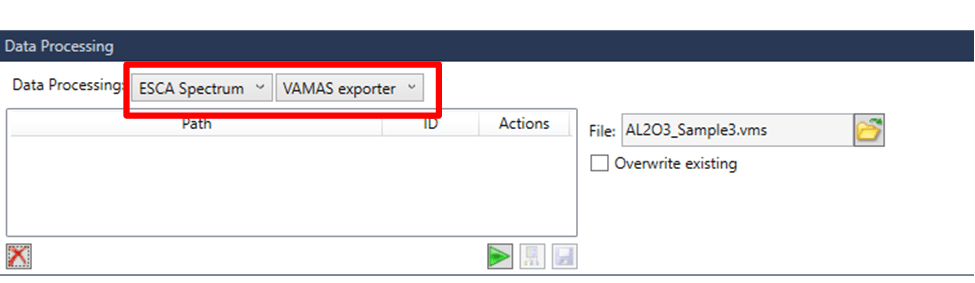
On the Data Processing window:
Choose “ESCA Spectrum” and “VAMAS exporter”
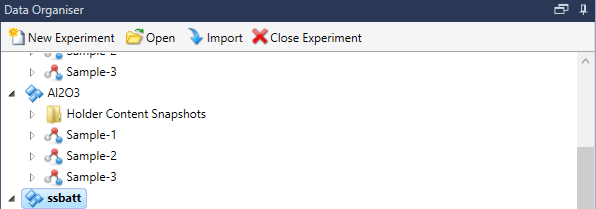
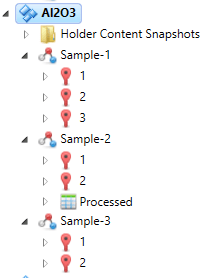
On the Data Organizer window:
Double click to expand the data you wish to export (Al2O3 in this case).
You can see there are 3 samples under Al2O3 :
And data were collected at three locations on sample 1; two locations on sample 2; two locations on sample 3.
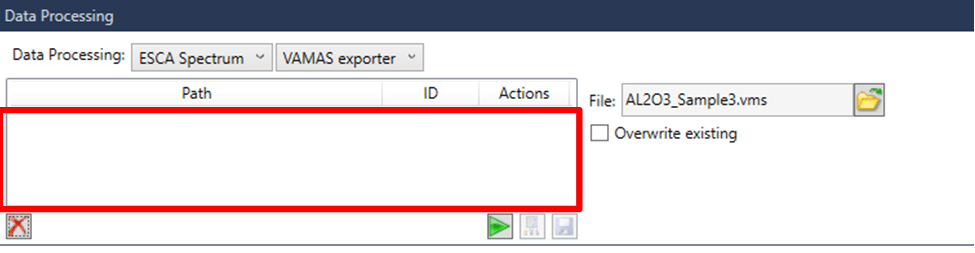
Hold and drag the data file into the Data processing window to display the spectrum:
We recommend that you export each sample one by one.
For instance, hold and drag the sample icon ![]() from the Data Organized window to the highlighted area of the Data Processing window. It should export all XPS data of sample 1.
from the Data Organized window to the highlighted area of the Data Processing window. It should export all XPS data of sample 1.
(You can also click to select unwanted spectrum and click ![]() to delete)
to delete)
Click ![]() to choose the folder and name your data.
to choose the folder and name your data.
Click ![]() to export.
to export.
Before exporting data of the next sample, press Ctrl+A in highlighted area shown above to select all previous data and click to delete them.
You can also drag the whole ![]() to export everything at once. But we don’t recommend that as it can get confusing when labeling data.
to export everything at once. But we don’t recommend that as it can get confusing when labeling data.
Image export:
The images of sample & sample locations are stored in the folder “Holder Content Snapshots”.
Double click to open image (26/05/2023 in this case).
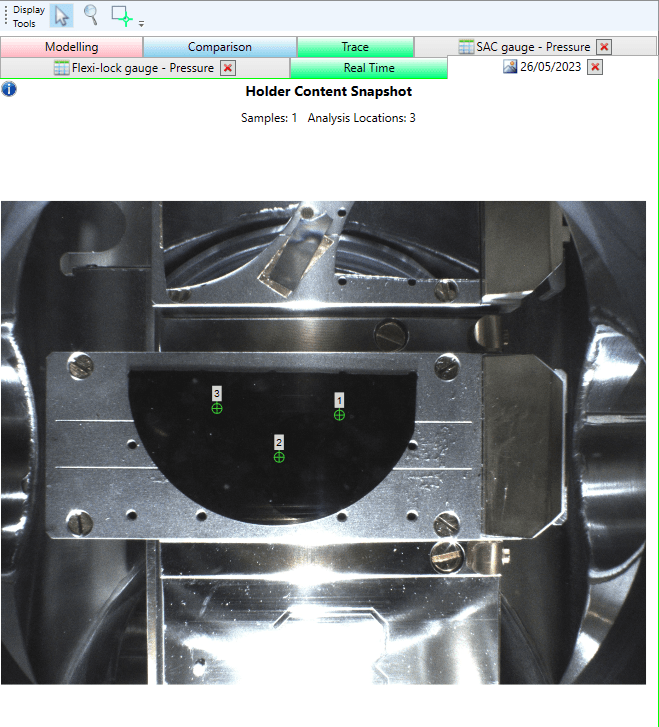
The images will open in the main window.
It shows all three locations where data collected on sample 1.
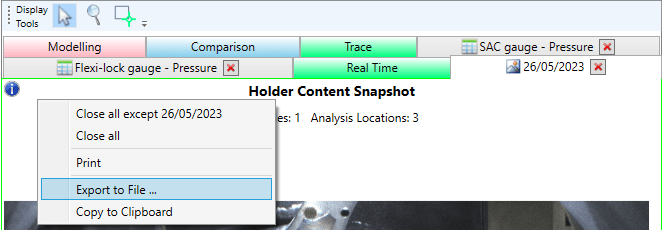
To export, right click on the blank area above the image (NOT on the image)
Then choose Export to File.
Data labeling in CasaXPS:
Sample 2 is used as an example.
(XPS Data of sample 2 were collected at 2 different locations using Al X-ray source and Ag X-ray source respectively).
There should be 4 sets of data.
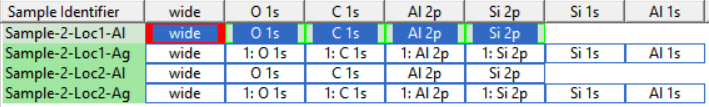
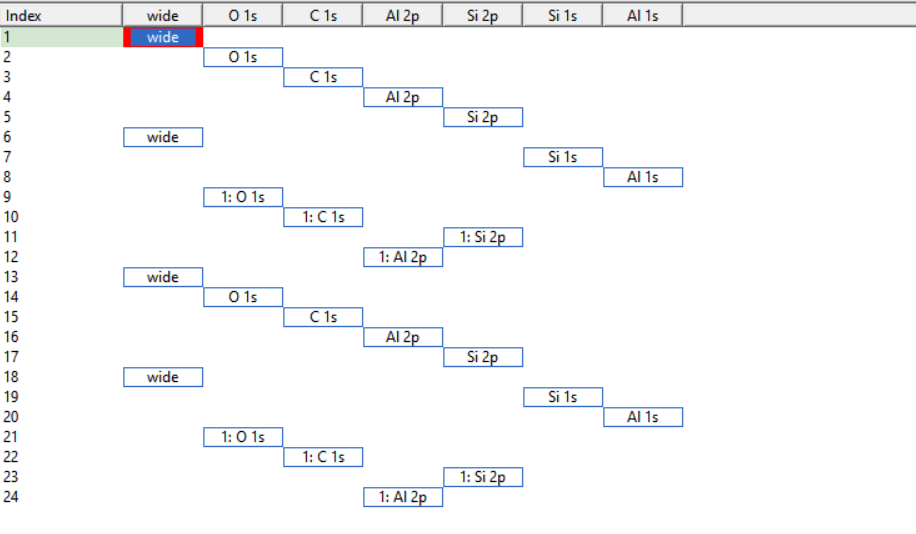
Below is a screenshot of Sample 2 data file in CasaXPS, different scans are usually separated by the wide scan (survey scan).
To obtain detailed information of each spectrum, go to Options -> Tile Display
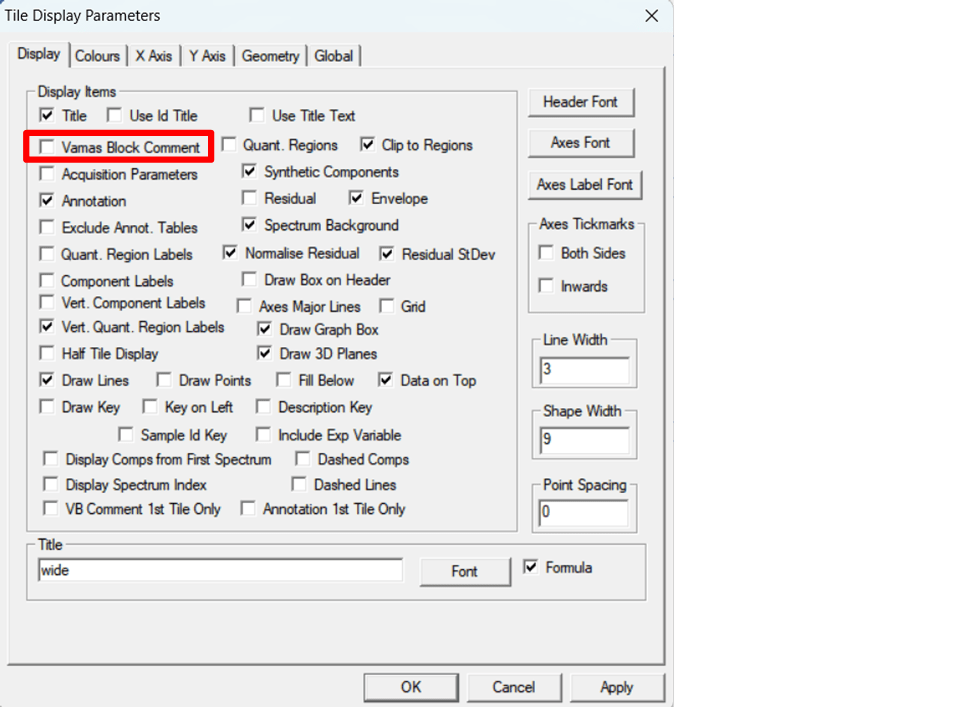
On the Tile display window, check “Vamas Block Comment”. Then click OK.
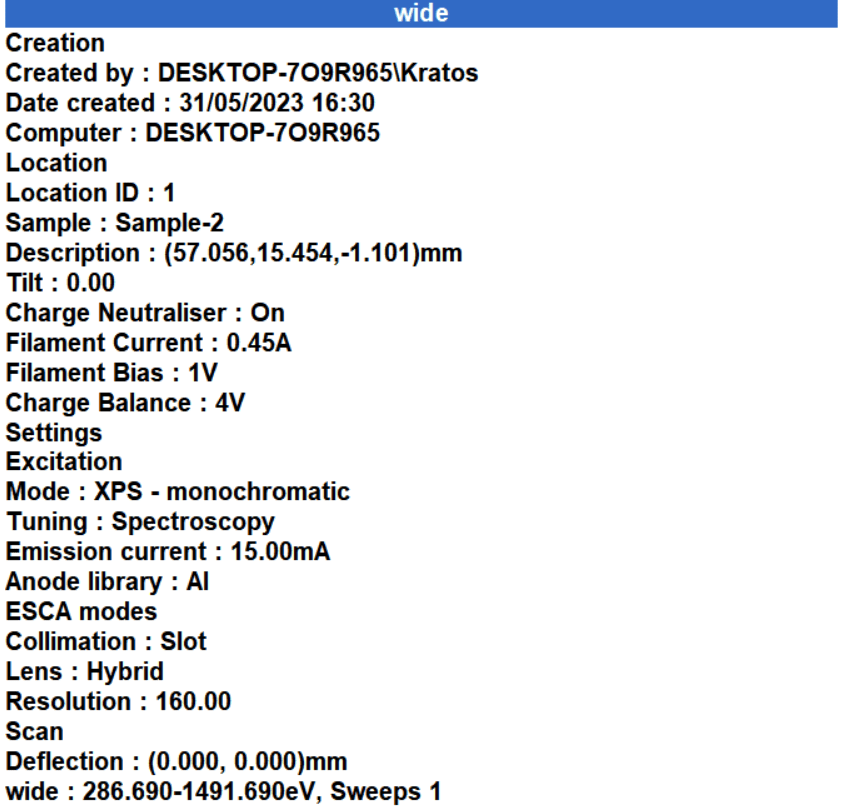
That will show all details, and we can see from the picture below that the location ID is 1 and the X-ray source is Al.
Double click on other spectrum to see their information.
After confirming that wide, O 1s, C 1s, Al 2p, Si 2p data were all collected at location 1 by Al X-ray source:
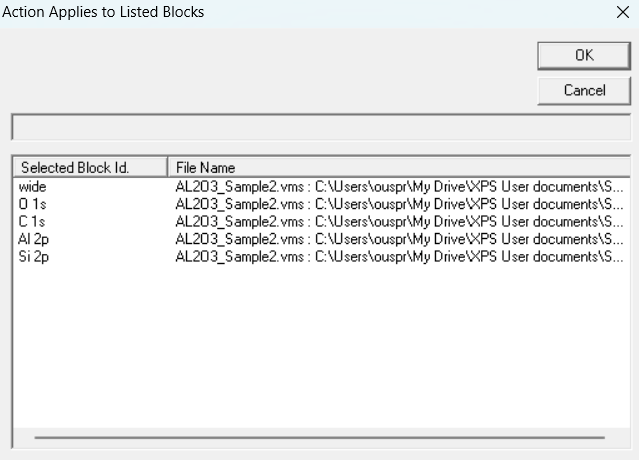
Click “1” in Index column, hold the Shift key, then click “5”.
You should now see “wide, O 1s, C 1s, Al 2p, Si 2p” all highlighted.

At the right of the toolbar, click “Edit sample ID”.

Uncheck “Update block ID, Update species/element, Update transition”; only check “Update sample ID”
Rename your sample ID.
In this example, the sample ID is changed to “Sample2- Loc1-Al”.
Click “Apply VAMAS Identifiers”.
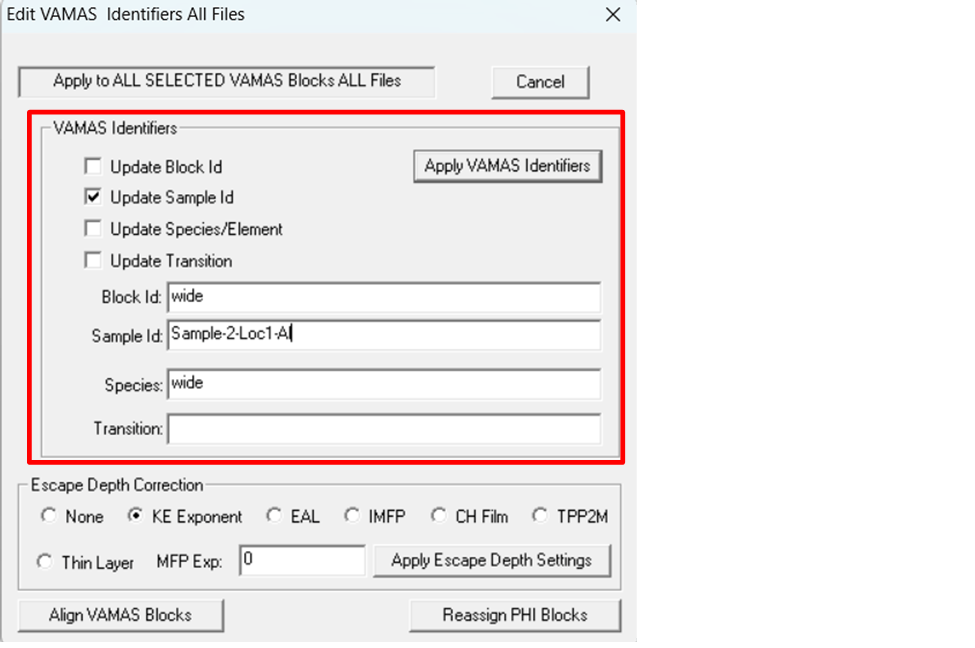
Then click “OK”.
Repeat for all the scans.
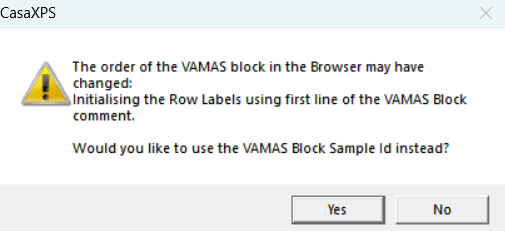
Click “Edit row labels on <-> off”

If the following message pops up, choose “Yes”.
Now your data should be all labeled and organized!